UNITED STATES
SECURITIES AND EXCHANGE COMMISSION
Washington, D.C. 20549
FORM
CURRENT REPORT
Pursuant to Section 13 or 15(d)
of the Securities Exchange Act of 1934
Date of Report (date of earliest event reported):
(Exact name of registrant as specified in its charter)
| (State or other jurisdiction of incorporation) |
(Commission File Number) |
(IRS Employer Identification No.) |
(Address of principal executive offices, including zip code)
Registrant’s telephone number, including area code:
Check the appropriate box below if the Form 8-K filing is intended to simultaneously satisfy the filing obligation of the registrant under any of the following provisions:
| Written communications pursuant to Rule 425 under the Securities Act (17 CFR 230.425) |
| Soliciting material pursuant to Rule 14a-12 under the Exchange Act (17 CFR 240.14a-12) |
| Pre-commencement communications pursuant to Rule 14d-2(b) under the Exchange Act (17 CFR 240.14d-2(b)) |
| Pre-commencement communications pursuant to Rule 13e-4(c) under the Exchange Act (17 CFR 240.13e-4(c)) |
Securities registered pursuant to Section 12(b) of the Act:
| Title of each class |
Trading |
Name of each exchange | ||
Indicate by check mark whether the registrant is an emerging growth company as defined in Rule 405 of the Securities Act of 1933 (§230.405 of this chapter) or Rule 12b-2 of the Securities Exchange Act of 1934 (§240.12b-2 of this chapter).
Emerging growth company
If an emerging growth company, indicate by check mark if the registrant has elected not to use the extended transition period for complying with any new or revised financial accounting standards provided pursuant to Section 13(a) of the Exchange Act. ☐
| Item 7.01 | Regulation FD Disclosure |
As previously announced, Duluth Holdings Inc. (the “Company”) is hosting an Investor & Analyst Event live from 11:00am to 1:00pm eastern time at the Nasdaq MarketSite in New York and via webcast.
The Company is furnishing a copy of the presentation that the Company intends to use at the Investor & Analyst Event as Exhibit 99.1 to this Current Report on Form 8-K.
The information reported in this Current Report Form 8-K, including the exhibit, is not deemed “filed” for the purposes of Section 18 of the Securities Exchange Act of 1934, or otherwise subject to the liabilities of that section. Further, the information reported in this Form 8-K, including the exhibit, shall not be deemed to be incorporated by reference into the filings of the registrant under the Securities Act of 1933, except as shall be expressly set forth by specific reference in such filings.
Forward Looking Information
This Current Report on Form 8-K contains forward-looking statements within the meaning of the Private Securities Litigation Reform Act of 1995. All statements, other than statements of historical facts included in this Form 8-K, including statements concerning Duluth Trading’s plans, objectives, goals, beliefs, business strategies, future events, business conditions, its results of operations, financial position and its business outlook, business trends and certain other information herein. You can identify forward looking statements by the use of words such as “may,” ”might,” “will,” “should,” “expect,” “plan,” “anticipate,” “could,” “believe,” “estimate,” “project,” “target,” “predict,” “intend,” “future,” “budget,” “goals,” “potential,” “continue,” “design,” “objective,” “forecasted,” “would” and other similar expressions. These statements reflect management’s current expectations and are based on assumptions and estimates that involve risks and uncertainties.
Actual results may differ materially from those expressed or implied. Factors that could cause differences include, but are not limited to, those described under “Risk Factors” in Duluth Trading’s most recent Annual Report on Form 10-K and subsequent SEC filings.
Forward-looking statements speak only as of the date the statements are made. Duluth Trading assumes no obligation to update them except as required by law.
| Item 9.01 | Financial Statements and Exhibits |
(d) Exhibits
| Exhibit |
Description | |
| 99.1 | Investor & Analyst Event Presentation, dated June 8, 2026 | |
| 104 | Cover Page Interactive Data File (embedded within the Inline XBRL document). | |
SIGNATURES
Pursuant to the requirements of the Securities Exchange Act of 1934, the registrant has duly caused this report to be signed on its behalf by the undersigned hereunto duly authorized.
| DULUTH HOLDINGS INC. | ||||||
| Dated: June 8, 2026 | By: | /s/ Heena Agrawal | ||||
| Heena Agrawal | ||||||
| Senior Vice President and Chief Financial Officer | ||||||
Exhibit 99.1 N A S D A Q · D L T H · I N V E S T O R & A N A L Y S T D A Y G R O W I N G F R O M T H E C O R E I NV E S T OR & A NA L Y S T E V E NT MONDAY · JUNE 8, 2026
S A F E H A R B O R S T A T E M E N T FORWARD-LOOKING STATEMENTS FORWARD-LOOKING STATEMENTS NON-GAAP FINANCIAL MEASURES This presentation contains forward-looking statements within the meaning of This presentation references Adjusted EBITDA and Free Cash Flow, which the Private Securities Litigation Reform Act of 1995. All statements, other are non-GAAP financial measures. Management believes these measures than statements of historical facts included in this presentation, including provide useful supplemental information for evaluating operating statements concerning Duluth Trading’s plans, objectives, goals, beliefs, performance and for comparison with peer companies. They are not business strategies, future events, business conditions, its results of intended to replace GAAP results and should be read in conjunction with operations, financial position and its business outlook, business trends and them. certain other information herein. You can identify forward looking statements by the use of words such as “may,” ”might,” “will,” “should,” “expect,” “plan,” Adjusted EBITDA excludes interest, taxes, depreciation, amortization, and “anticipate,” “could,” “believe,” “estimate,” “project,” “target,” “predict,” certain non-recurring or non-comparable items. Free Cash Flow is defined “intend,” “future,” “budget,” “goals,” “potential,” “continue,” “design,” as net cash provided by operating activities less capital expenditures. “objective,” “forecasted,” “would” and other similar expressions. These statements reflect management's current expectations and are based on Non-GAAP reconciliation tables are included in the appendix to this assumptions and estimates that involve risks and uncertainties. presentation. Actual results may differ materially from those expressed or implied. Factors that could cause differences include, but are not limited to, those described under Risk Factors in Duluth Trading's most recent Annual Report on Form 10-K and subsequent SEC filings. Forward-looking statements speak only as of the date of this presentation. Duluth Trading assumes no obligation to update them except as required by law. 0 2
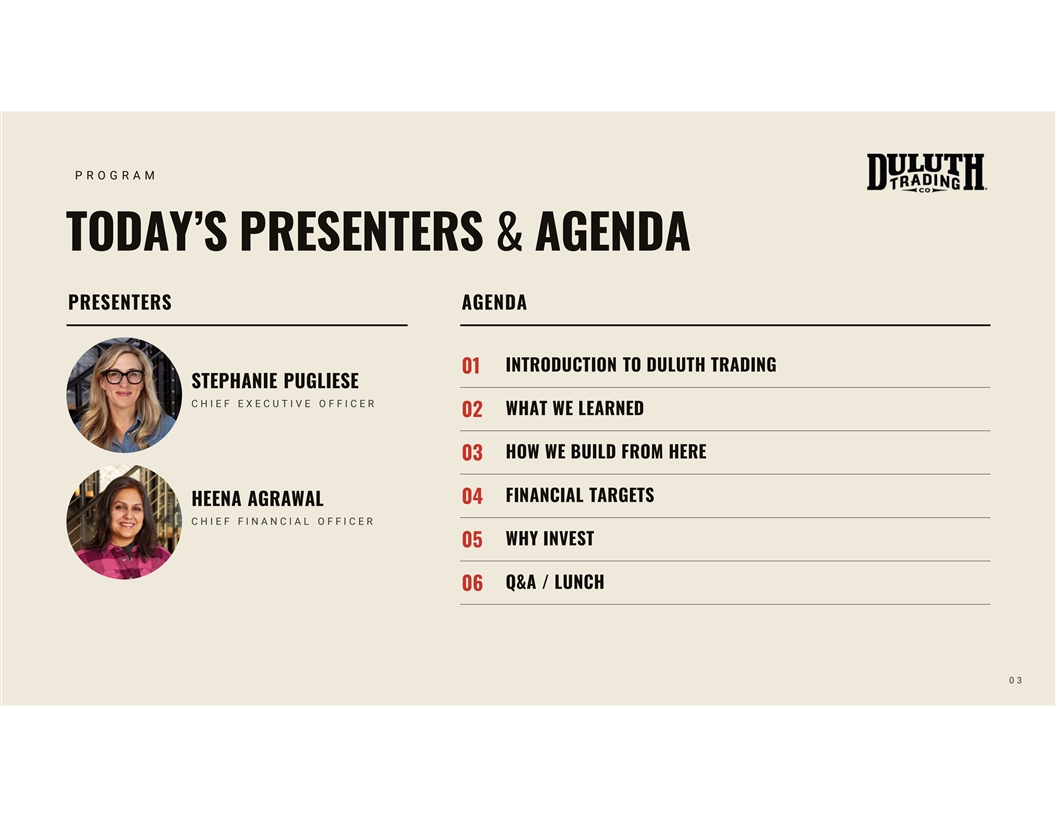
P R O G R A M TODAY’S PRESENTERS & AGENDA PRESENTERS AGENDA INTRODUCTION TO DULUTH TRADING 01 STEPHANIE PUGLIESE C H I E F E X E C U T I V E O F F I C E R WHAT WE LEARNED 02 HOW WE BUILD FROM HERE 03 FINANCIAL TARGETS 04 HEENA AGRAWAL C H I E F F I N A N C I A L O F F I C E R WHY INVEST 05 Q&A / LUNCH 06 0 3
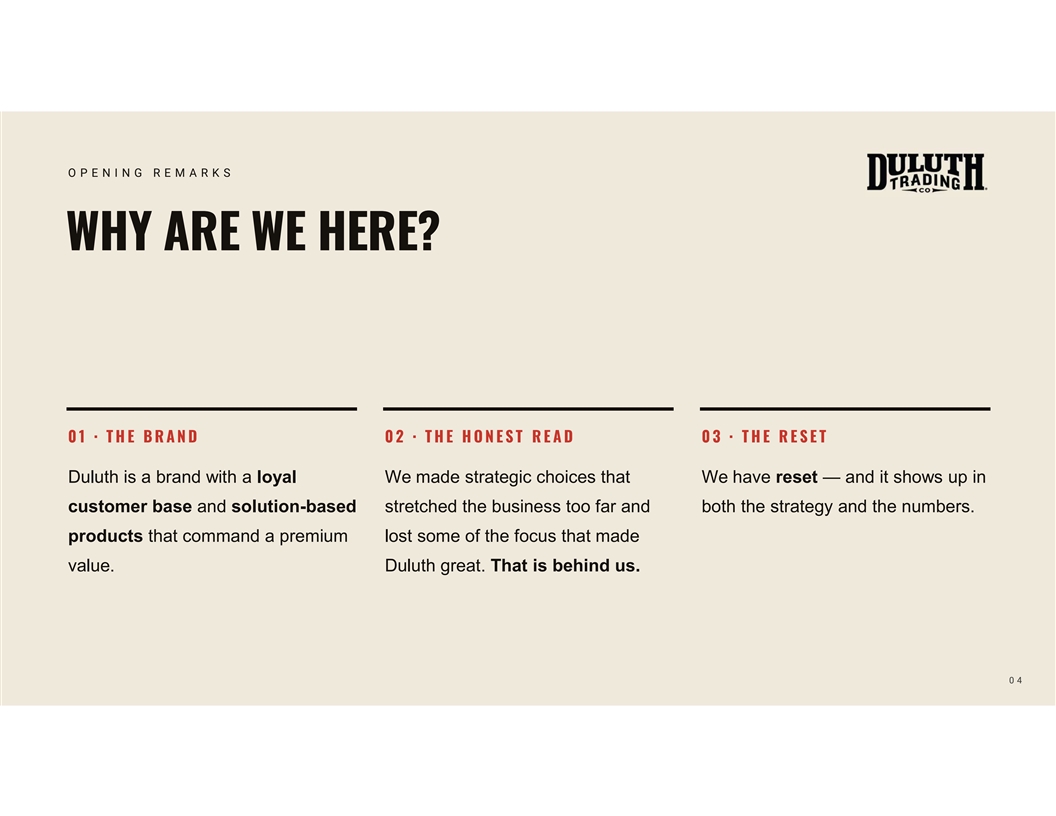
O P E N I N G R E M A R K S WHY ARE WE HERE? 0 1 · T H E B R A N D 0 2 · T H E H O N E S T R E A D 0 3 · T H E R E S E T Duluth is a brand with a loyal We made strategic choices that We have reset — and it shows up in customer base and solution-based stretched the business too far and both the strategy and the numbers. products that command a premium lost some of the focus that made value. Duluth great. That is behind us. 0 4

BUT FIRST, LET’S TALK ABOUT WHAT MAKES DULUTH SPECIAL… 0 5
C H A P T E R O N E INTRODUCTION to DULUTH TRADING COMPANY 0 6
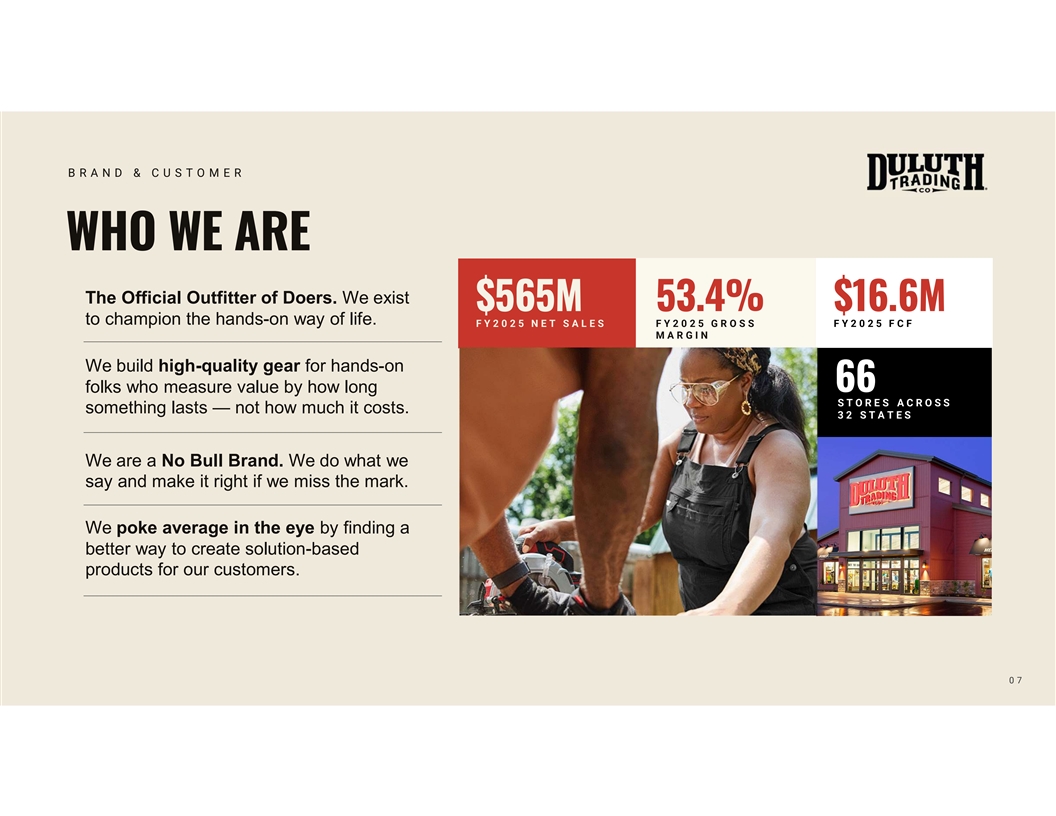
B R A N D & C U S T O M E R WHO WE ARE The Official Outfitter of Doers. We exist $565M 53.4% $16.6M to champion the hands-on way of life. F Y 2 0 2 5 N E T S A L E S F Y 2 0 2 5 G R O S S F Y 2 0 2 5 F C F M A R G I N We build high-quality gear for hands-on 66 folks who measure value by how long S T O R E S A C R O S S something lasts — not how much it costs. 3 2 S T A T E S We are a No Bull Brand. We do what we say and make it right if we miss the mark. We poke average in the eye by finding a better way to create solution-based products for our customers. 0 7
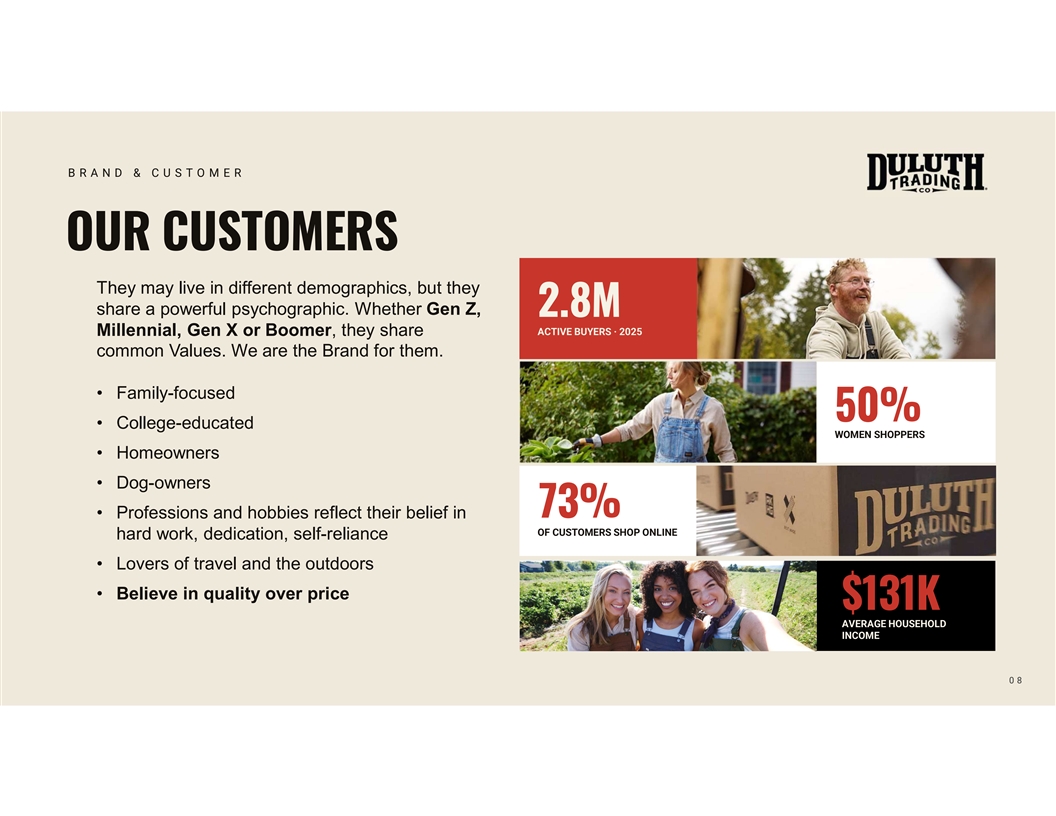
B R A N D & C U S T O M E R OUR CUSTOMERS They may live in different demographics, but they share a powerful psychographic. Whether Gen Z, 2.8M Millennial, Gen X or Boomer, they share ACTIVE BUYERS · 2025 common Values. We are the Brand for them. • Family-focused 50% • College-educated WOMEN SHOPPERS • Homeowners • Dog-owners 73% • Professions and hobbies reflect their belief in OF CUSTOMERS SHOP ONLINE hard work, dedication, self-reliance • Lovers of travel and the outdoors • Believe in quality over price $131K AVERAGE HOUSEHOLD INCOME 0 8
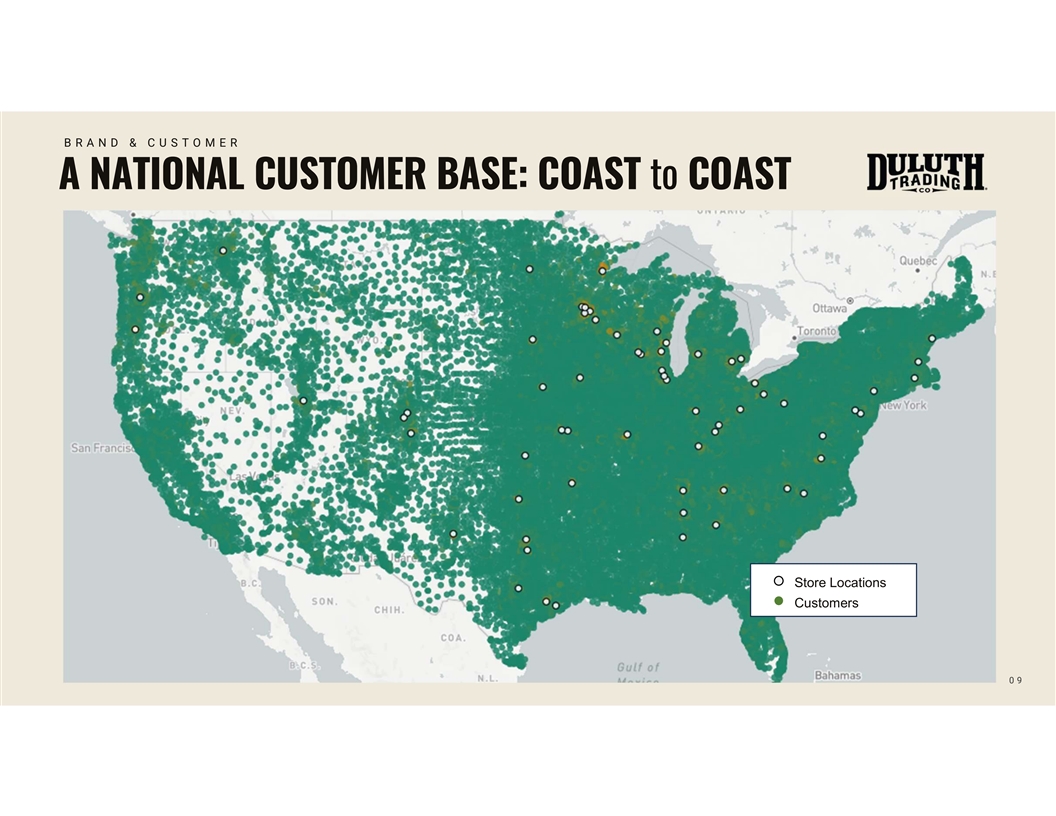
B R A N D & C U S T O M E R A NATIONAL CUSTOMER BASE: COAST to COAST Store Locations Customers 0 9
O U R C U L T U R E OUR FIVE WELDS 01 PRODUCT IS OUR PASSION. 02 THE CUSTOMER IS OUR COMPASS. 03 PEOPLE SET US APART. 04 ONWARD. ALWAYS. 05 WE POKE AVERAGE IN THE EYE. 1 0
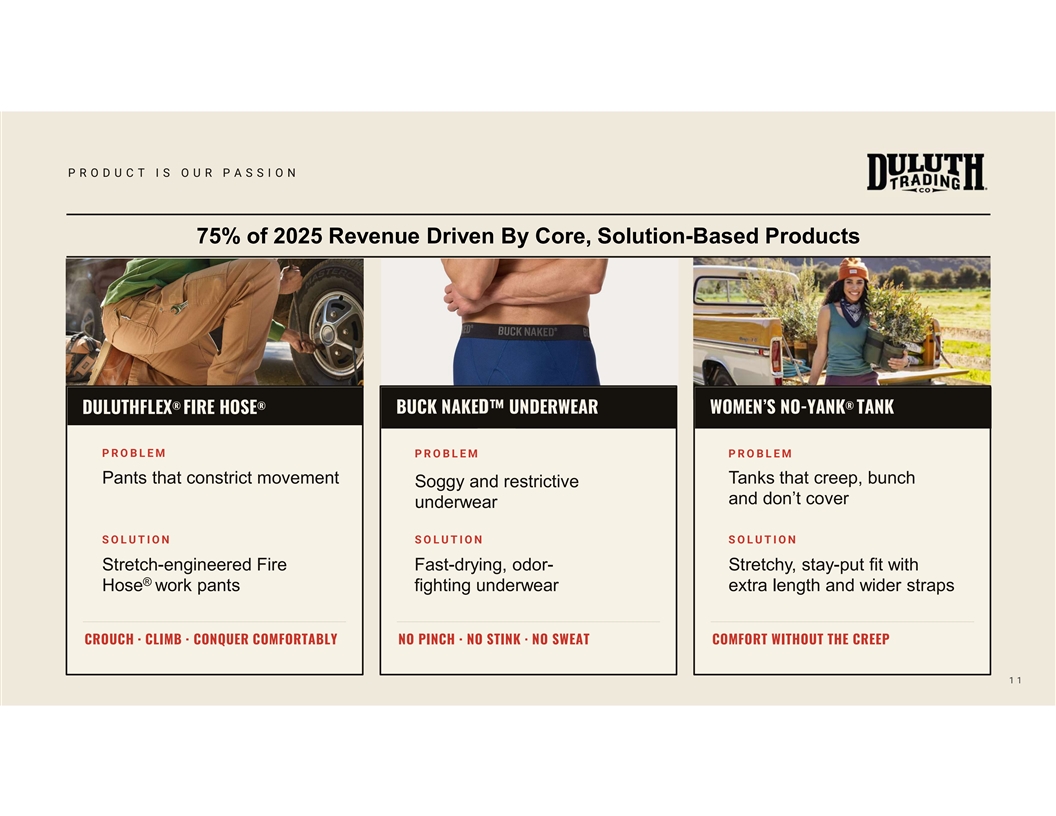
P R O D U C T I S O U R P A S S I O N 75% of 2025 Revenue Driven By Core, Solution-Based Products ® ® ® BUCK NAKED UNDERWEAR WOMEN’S NO-YANK TANK DULUTHFLEX FIRE HOSE P R O B L E M P R O B L E M P R O B L E M Pants that constrict movement Tanks that creep, bunch Soggy and restrictive and don’t cover underwear S O L U T I O N S O L U T I O N S O L U T I O N Stretch-engineered Fire Fast-drying, odor- Stretchy, stay-put fit with ® Hose work pants fighting underwear extra length and wider straps CROUCH · CLIMB · CONQUER COMFORTABLY NO PINCH · NO STINK · NO SWEAT COMFORT WITHOUT THE CREEP 1 1
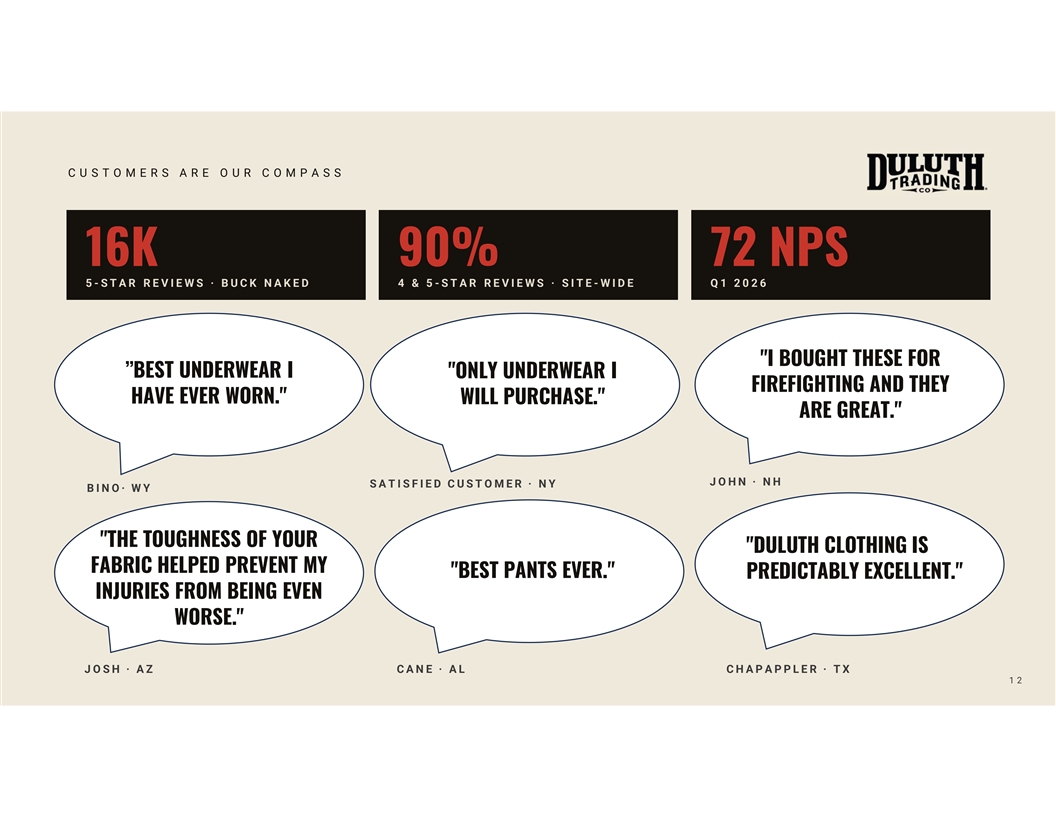
C U S T O M E R S A R E O U R C O M P A S S 16K 90% 72 NPS 5 - S T A R R E V I E W S · B U C K N A K E D 4 & 5 - S T A R R E V I E W S · S I T E - W I D E Q 1 2 0 2 6 I BOUGHT THESE FOR ”BEST UNDERWEAR I ONLY UNDERWEAR I FIREFIGHTING AND THEY HAVE EVER WORN. WILL PURCHASE. ARE GREAT. J O H N · N H S A T I S F I E D C U S T O M E R · N Y B I N O · W Y THE TOUGHNESS OF YOUR DULUTH CLOTHING IS FABRIC HELPED PREVENT MY BEST PANTS EVER. PREDICTABLY EXCELLENT. INJURIES FROM BEING EVEN WORSE. J O S H · A Z C A N E · A L C H A P A P P L E R · T X 1 2
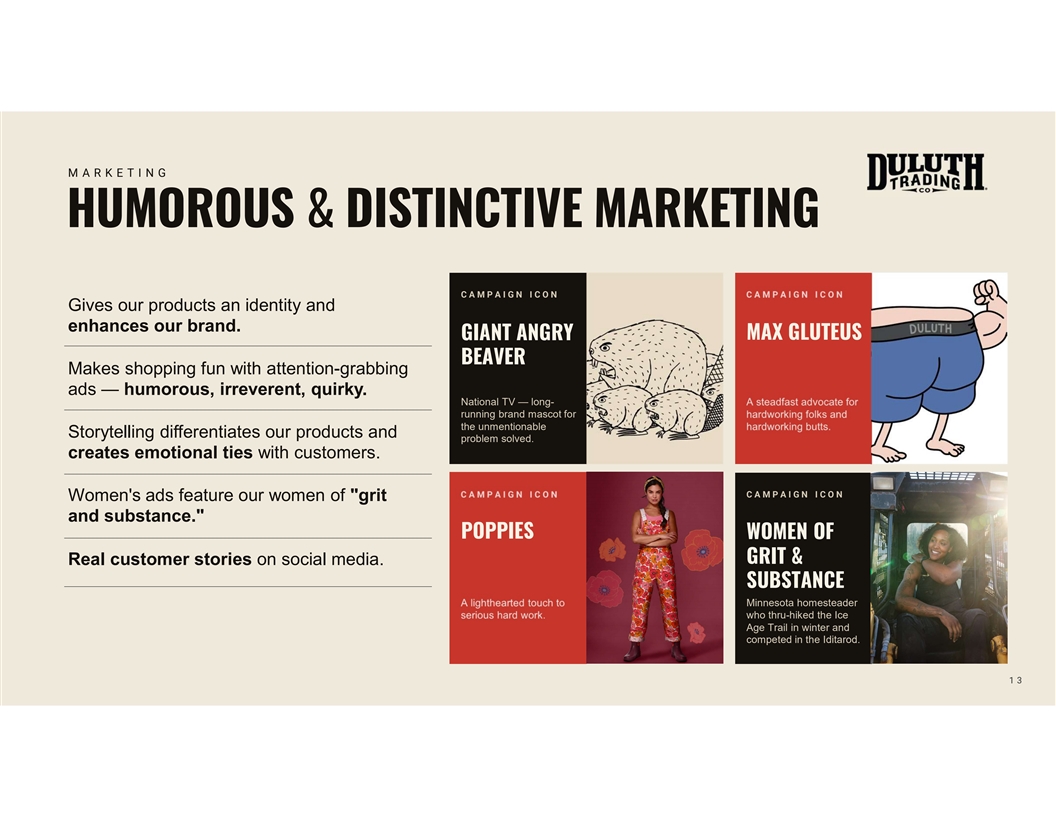
M A R K E T I N G HUMOROUS & DISTINCTIVE MARKETING C A M P A I G N I C O N Gives our products an identity and enhances our brand. GIANT ANGRY MAX GLUTEUS BEAVER Makes shopping fun with attention-grabbing ads — humorous, irreverent, quirky. National TV — long- running brand mascot for the unmentionable Storytelling differentiates our products and problem solved. creates emotional ties with customers. C A M P A I G N I C O N Women's ads feature our women of grit and substance. POPPIES WOMEN OF GRIT & Real customer stories on social media. SUBSTANCE Minnesota homesteader who thru-hiked the Ice Age Trail in winter and competed in the Iditarod. 1 3

M A R K E T I N G EVOLUTION of MARKETING 1 4
C H A P T E R T W O WHAT WE HAVE LEARNED 1 5
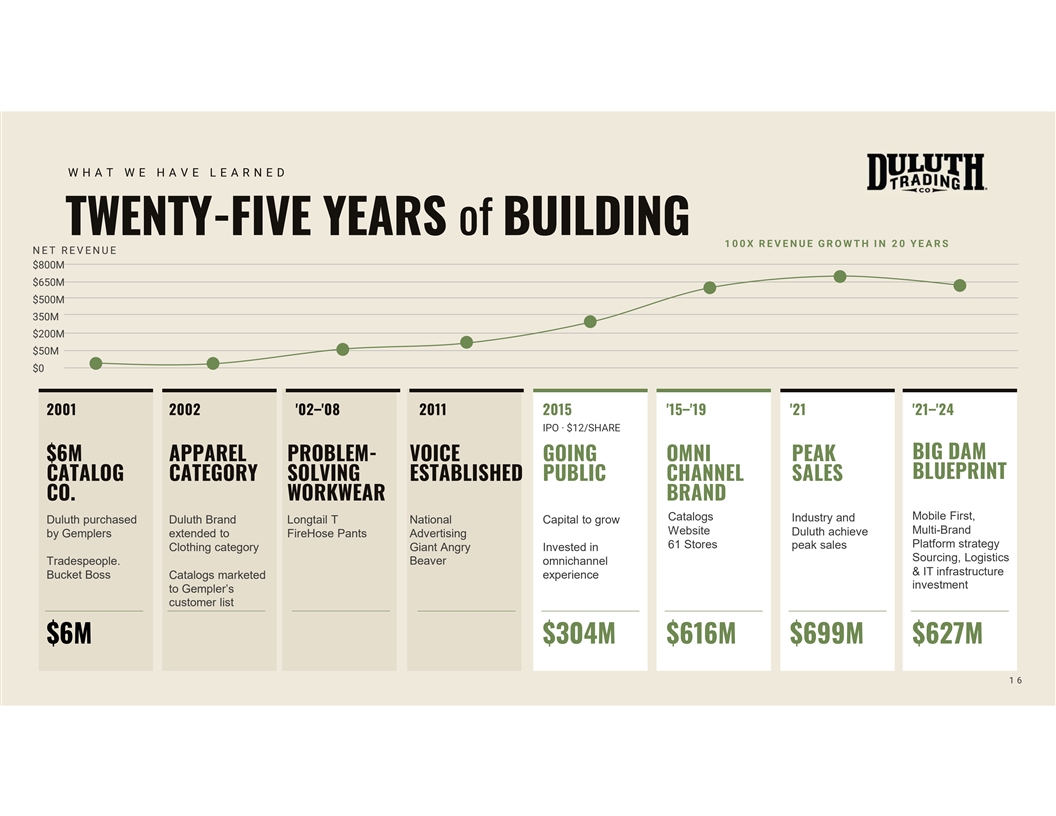
W H A T W E H A V E L E A R N E D TWENTY-FIVE YEARS of BUILDING 1 0 0 X R E V E N U E G R O W T H I N 2 0 Y E A R S N E T R E V E N U E $800M $650M $500M 350M $200M $50M $0 2001 2002 '02–'08 2011 2015 '15–'19 '21 '21–'24 IPO · $12/SHARE BIG DAM $6M APPAREL PROBLEM- VOICE GOING OMNI PEAK BLUEPRINT CATALOG CATEGORY SOLVING ESTABLISHED PUBLIC CHANNEL SALES CO. WORKWEAR BRAND Mobile First, Catalogs Industry and Duluth purchased Duluth Brand Longtail T National Capital to grow Multi-Brand Website Duluth achieve by Gemplers extended to FireHose Pants Advertising 61 Stores Platform strategy peak sales Clothing category Giant Angry Invested in Sourcing, Logistics Tradespeople. Beaver omnichannel & IT infrastructure Bucket Boss Catalogs marketed experience investment to Gempler’s customer list $6M $304M $616M $699M $627M 1 6
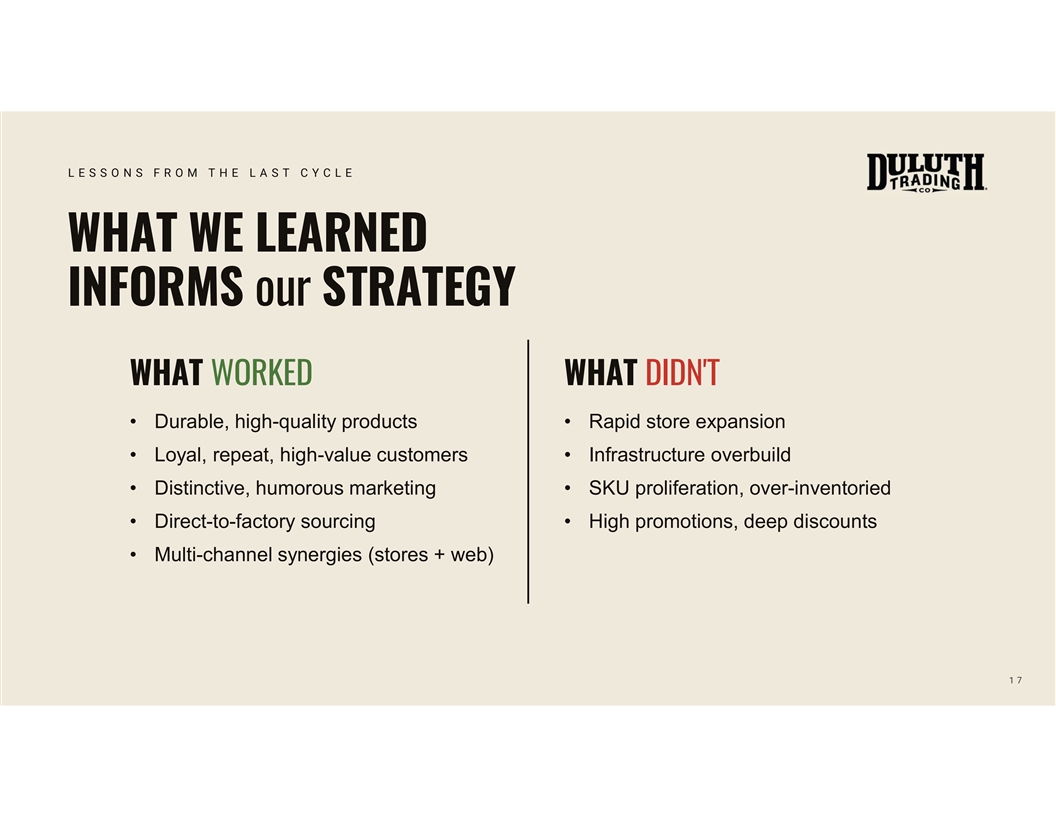
L E S S O N S F R O M T H E L A S T C Y C L E WHAT WE LEARNED INFORMS our STRATEGY WHAT WORKED WHAT DIDN'T • Durable, high-quality products • Rapid store expansion • Loyal, repeat, high-value customers • Infrastructure overbuild • Distinctive, humorous marketing • SKU proliferation, over-inventoried • Direct-to-factory sourcing • High promotions, deep discounts • Multi-channel synergies (stores + web) 1 7
C H A P T E R T H R E E HOW WE BUILD from HERE 1 8
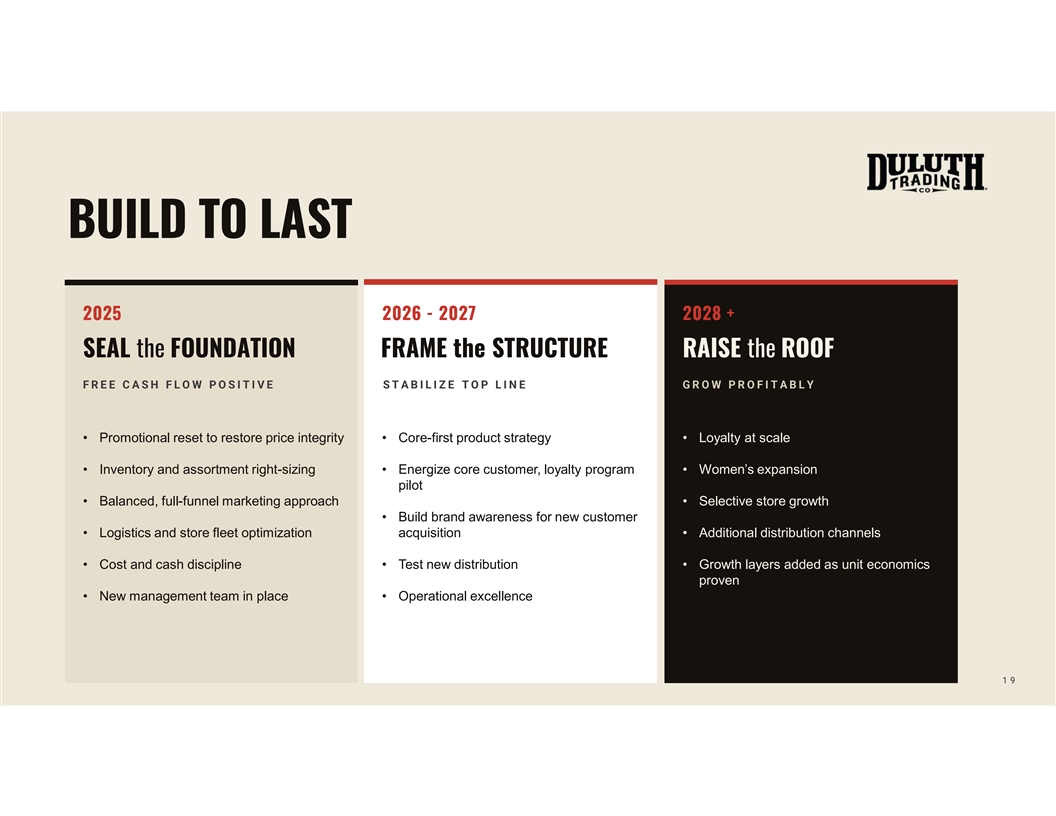
BUILD TO LAST 2025 2026 - 2027 2028 + SEAL the FOUNDATION FRAME the STRUCTURE RAISE the ROOF F R E E C A S H F L O W P O S I T I V E S T A B I L I Z E T O P L I N E G R O W P R O F I T A B L Y 2026 — 2027 FRAME the STRUCTURE • Promotional reset to restore price integrity • Core-first product strategy • Loyalty at scale S T A B I L I Z E T O P L I N E • Inventory and assortment right-sizing • Energize core customer, loyalty program • Women’s expansion pilot • Balanced, full-funnel marketing approach • Selective store growth • Build brand awareness for new customer • Logistics and store fleet optimization acquisition • Additional distribution channels • Cost and cash discipline • Test new distribution • Growth layers added as unit economics proven • New management team in place • Operational excellence 1 9
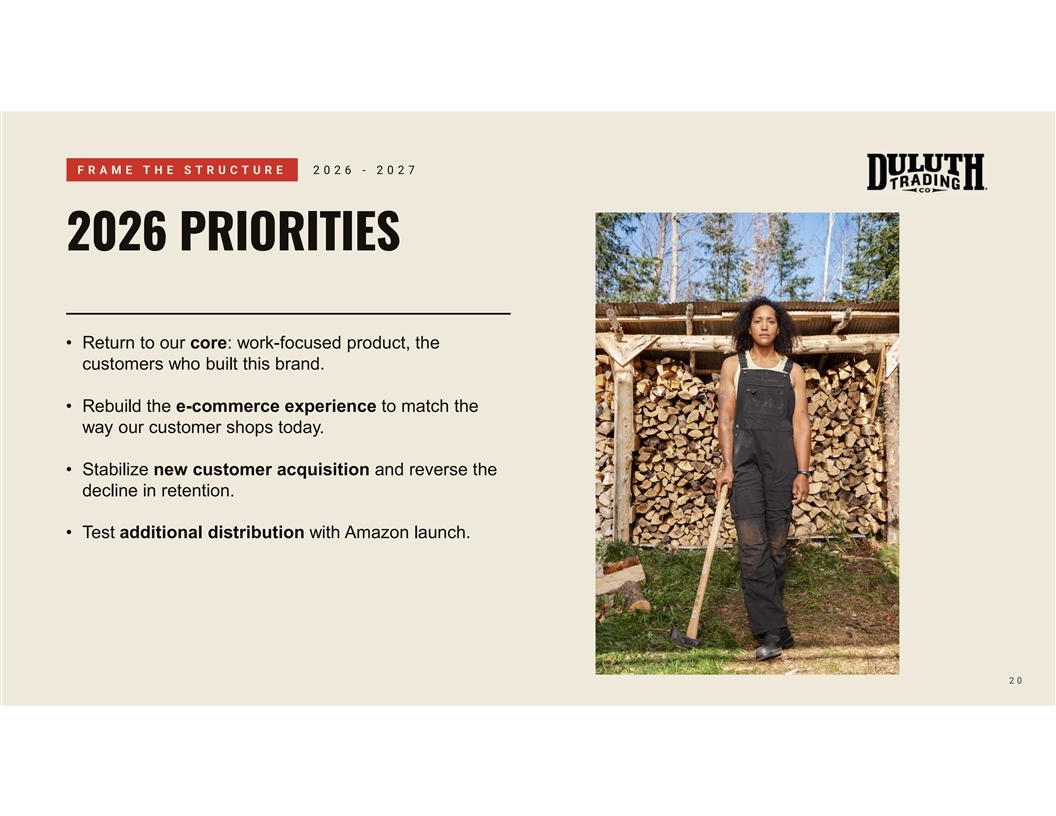
F R A M E T H E S T R U C T U R E 2 0 2 6 - 2 0 2 7 2026 PRIORITIES • Return to our core: work-focused product, the customers who built this brand. • Rebuild the e-commerce experience to match the way our customer shops today. • Stabilize new customer acquisition and reverse the decline in retention. • Test additional distribution with Amazon launch. 2 0
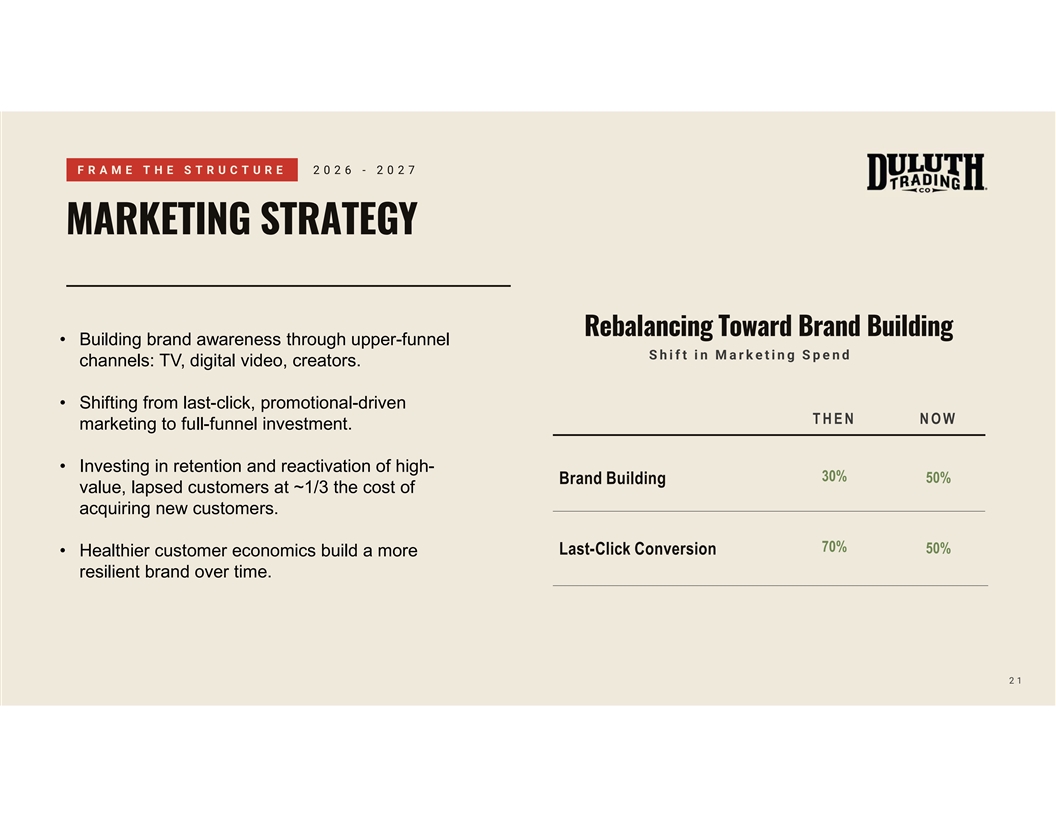
F R A M E T H E S T R U C T U R E 2 0 2 6 - 2 0 2 7 MARKETING STRATEGY Rebalancing Toward Brand Building • Building brand awareness through upper-funnel S h i f t i n M a r k e t i n g S p e n d channels: TV, digital video, creators. • Shifting from last-click, promotional-driven T H E N N O W marketing to full-funnel investment. • Investing in retention and reactivation of high- 30% 50% Brand Building value, lapsed customers at ~1/3 the cost of acquiring new customers. 70% 50% Last-Click Conversion • Healthier customer economics build a more resilient brand over time. 2 1
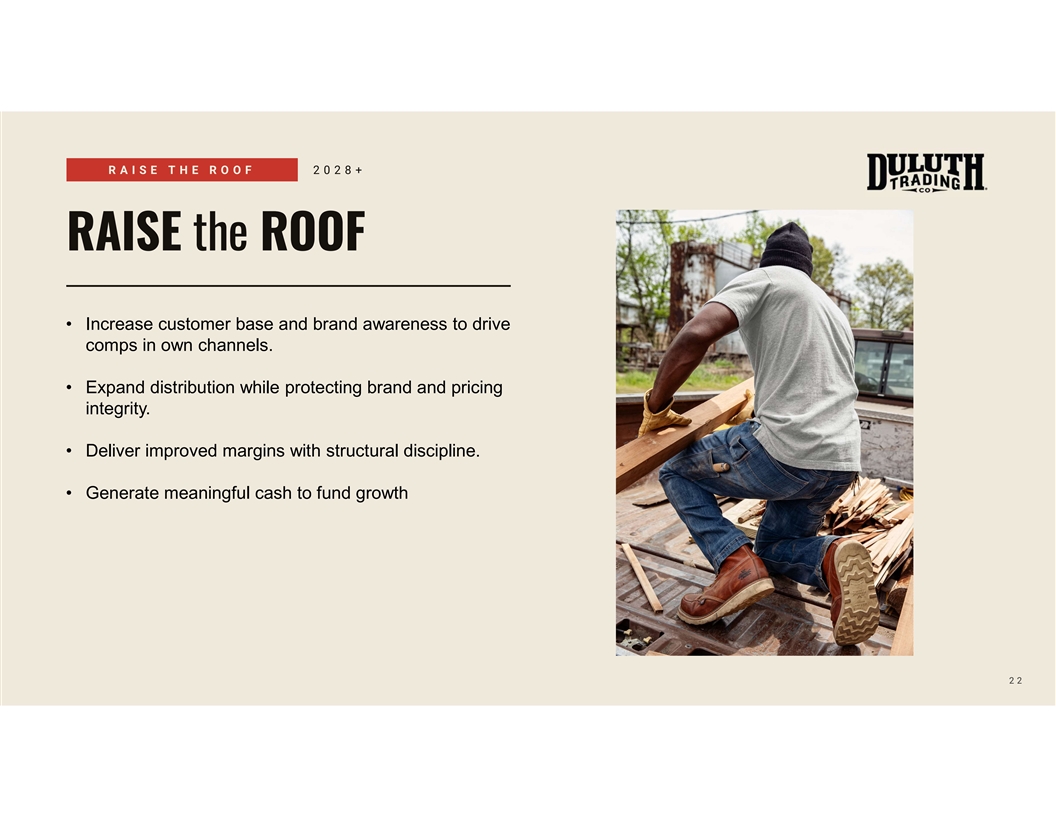
R A I S E T H E R O O F 2 0 2 8 + RAISE the ROOF • Increase customer base and brand awareness to drive comps in own channels. • Expand distribution while protecting brand and pricing integrity. • Deliver improved margins with structural discipline. • Generate meaningful cash to fund growth 2 2
C H A P T E R F O U R FINANCIAL TARGETS 2 3
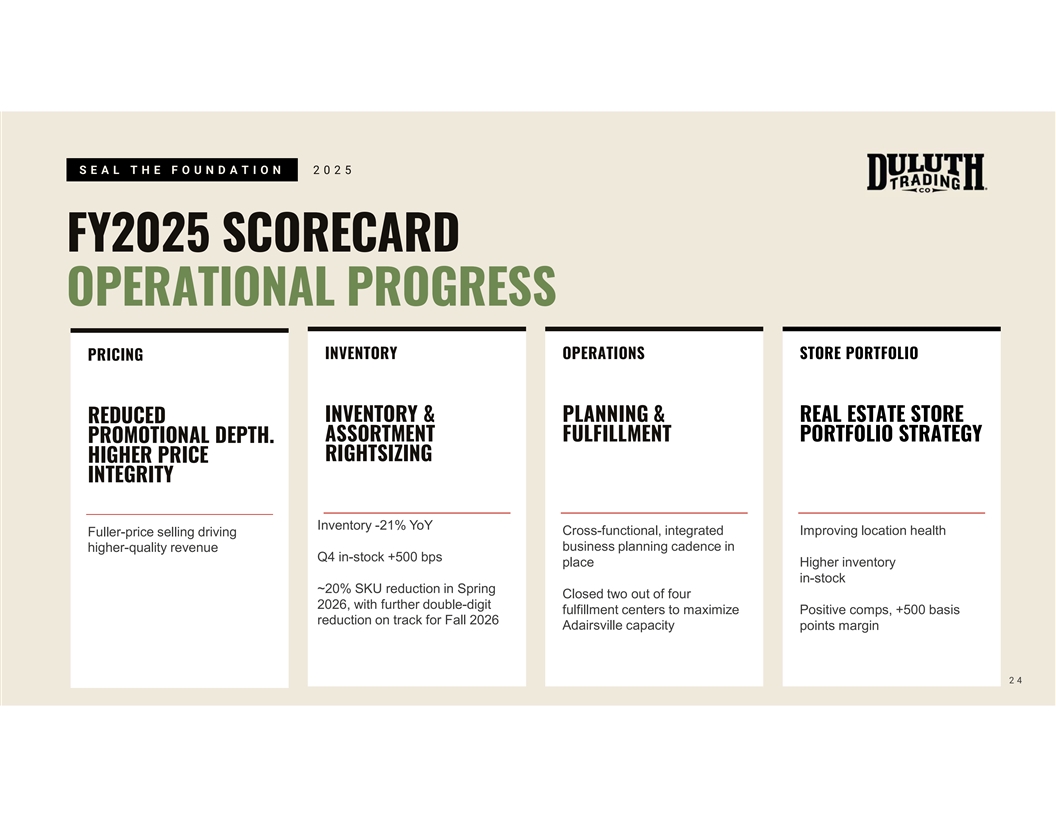
S E A L T H E F O U N D A T I O N 2 0 2 5 FY2025 SCORECARD OPERATIONAL PROGRESS INVENTORY OPERATIONS STORE PORTFOLIO PRICING INVENTORY & PLANNING & REAL ESTATE STORE REDUCED ASSORTMENT FULFILLMENT PORTFOLIO STRATEGY PROMOTIONAL DEPTH. RIGHTSIZING HIGHER PRICE INTEGRITY Inventory -21% YoY Cross-functional, integrated Improving location health Fuller-price selling driving business planning cadence in higher-quality revenue Q4 in-stock +500 bps place Higher inventory in-stock ~20% SKU reduction in Spring Closed two out of four 2026, with further double-digit fulfillment centers to maximize Positive comps, +500 basis reduction on track for Fall 2026 Adairsville capacity points margin 2 4
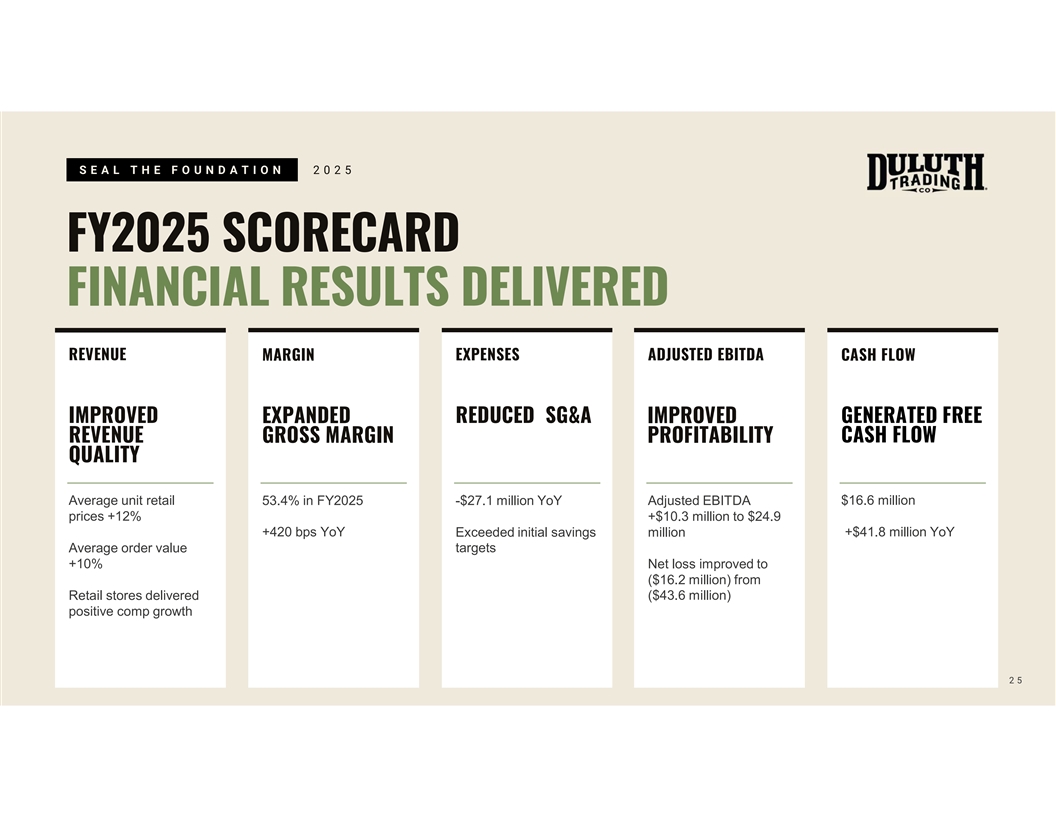
S E A L T H E F O U N D A T I O N 2 0 2 5 FY2025 SCORECARD FINANCIAL RESULTS DELIVERED REVENUE EXPENSES ADJUSTED EBITDA MARGIN CASH FLOW IMPROVED REDUCED SG&A GENERATED FREE EXPANDED IMPROVED REVENUE GROSS MARGIN PROFITABILITY CASH FLOW QUALITY Average unit retail 53.4% in FY2025 -$27.1 million YoY Adjusted EBITDA $16.6 million prices +12% +$10.3 million to $24.9 +420 bps YoY +$41.8 million YoY Exceeded initial savings million Average order value targets +10% Net loss improved to ($16.2 million) from Retail stores delivered ($43.6 million) positive comp growth 2 5
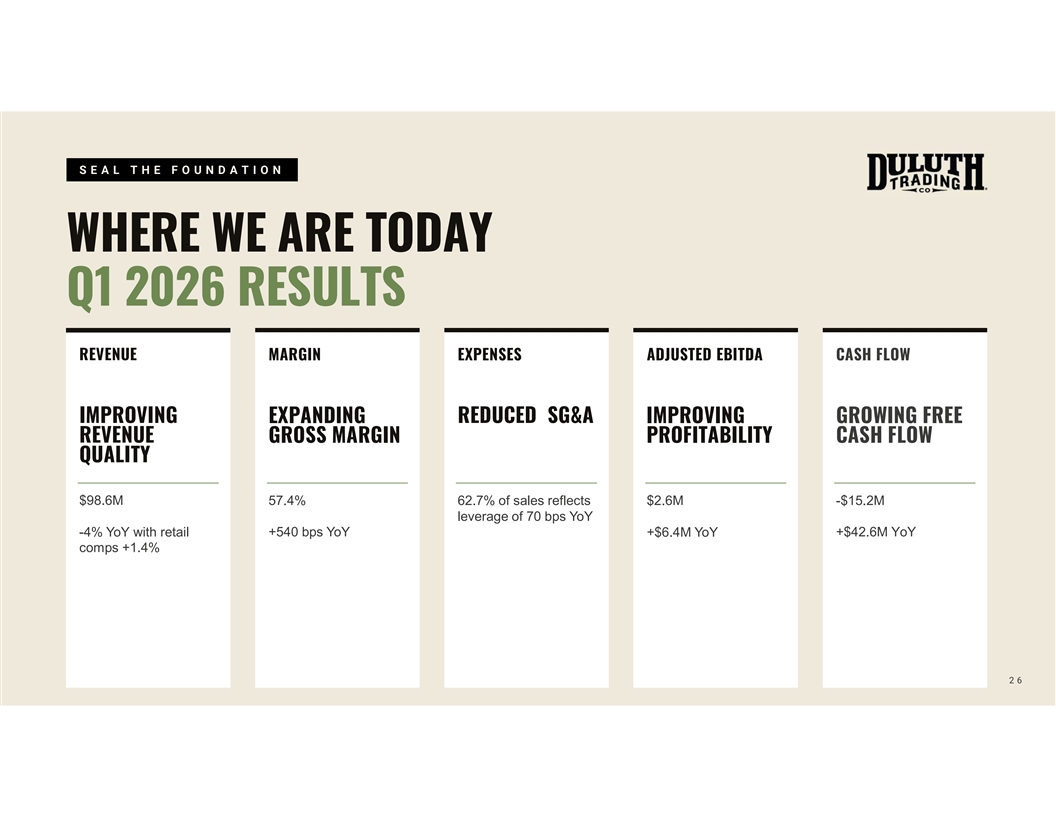
S E A L T H E F O U N D A T I O N WHERE WE ARE TODAY Q1 2026 RESULTS REVENUE MARGIN EXPENSES ADJUSTED EBITDA CASH FLOW IMPROVING REDUCED SG&A EXPANDING IMPROVING GROWING FREE REVENUE GROSS MARGIN PROFITABILITY CASH FLOW QUALITY $98.6M 57.4% 62.7% of sales reflects $2.6M -$15.2M leverage of 70 bps YoY +540 bps YoY +$42.6M YoY -4% YoY with retail +$6.4M YoY comps +1.4% 2 6
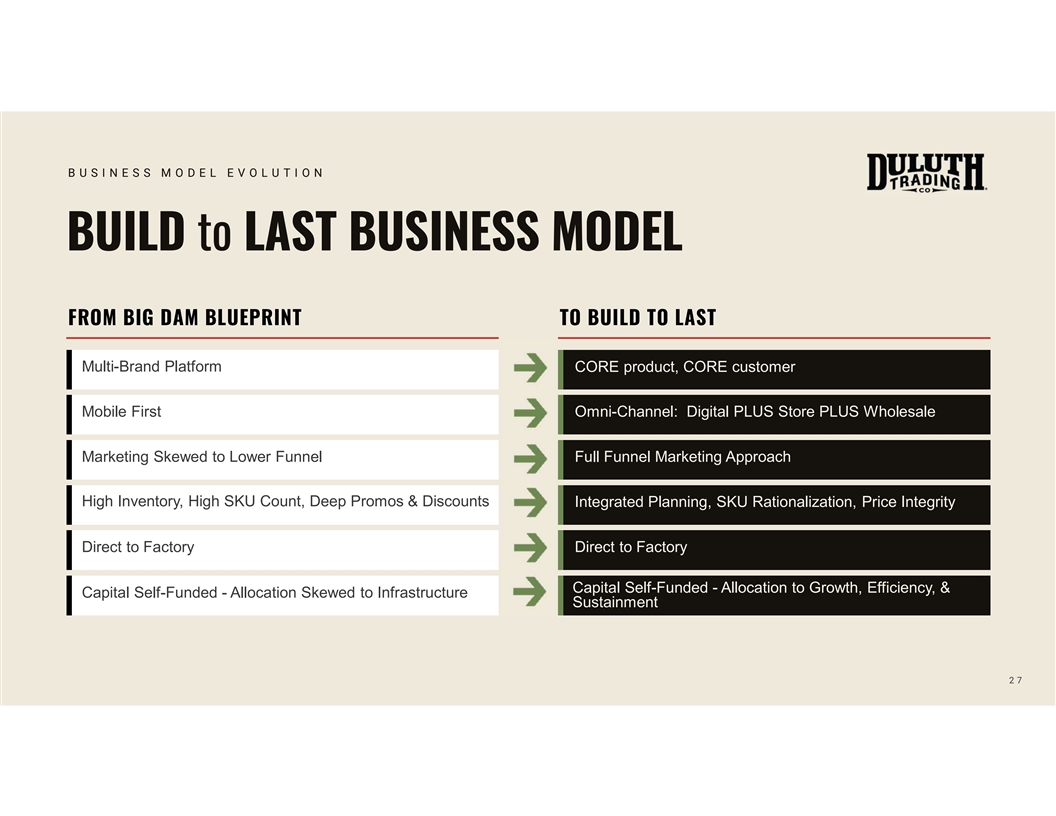
B U S I N E S S M O D E L E V O L U T I O N BUILD to LAST BUSINESS MODEL FROM BIG DAM BLUEPRINT TO BUILD TO LAST Multi-Brand Platform CORE product, CORE customer Mobile First Omni-Channel: Digital PLUS Store PLUS Wholesale Marketing Skewed to Lower Funnel Full Funnel Marketing Approach High Inventory, High SKU Count, Deep Promos & Discounts Integrated Planning, SKU Rationalization, Price Integrity Direct to Factory Direct to Factory Capital Self-Funded - Allocation to Growth, Efficiency, & Capital Self-Funded - Allocation Skewed to Infrastructure Sustainment 2 7
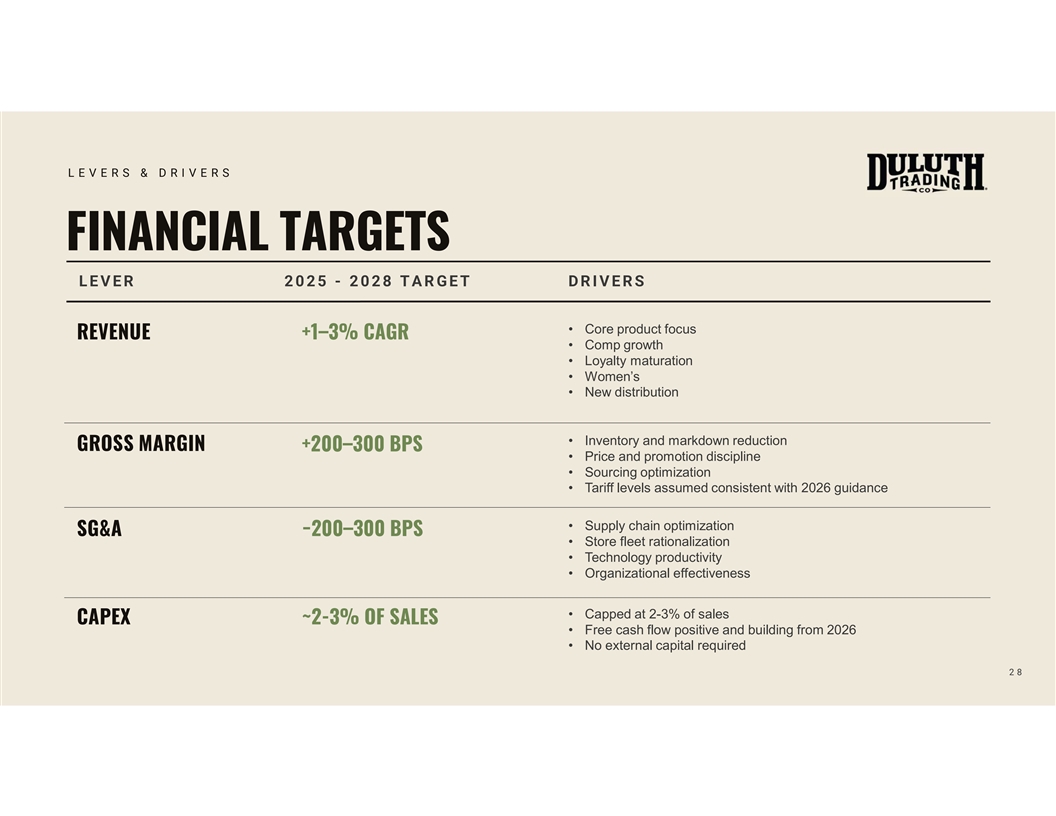
L E V E R S & D R I V E R S FINANCIAL TARGETS L E V E R 2 0 2 5 - 2 0 2 8 T A R G E T D R I V E R S • Core product focus REVENUE +1–3% CAGR • Comp growth • Loyalty maturation • Women’s • New distribution • Inventory and markdown reduction GROSS MARGIN +200–300 BPS • Price and promotion discipline • Sourcing optimization • Tariff levels assumed consistent with 2026 guidance • Supply chain optimization SG&A −200–300 BPS • Store fleet rationalization • Technology productivity • Organizational effectiveness • Capped at 2-3% of sales CAPEX ~2-3% OF SALES • Free cash flow positive and building from 2026 • No external capital required 2 8
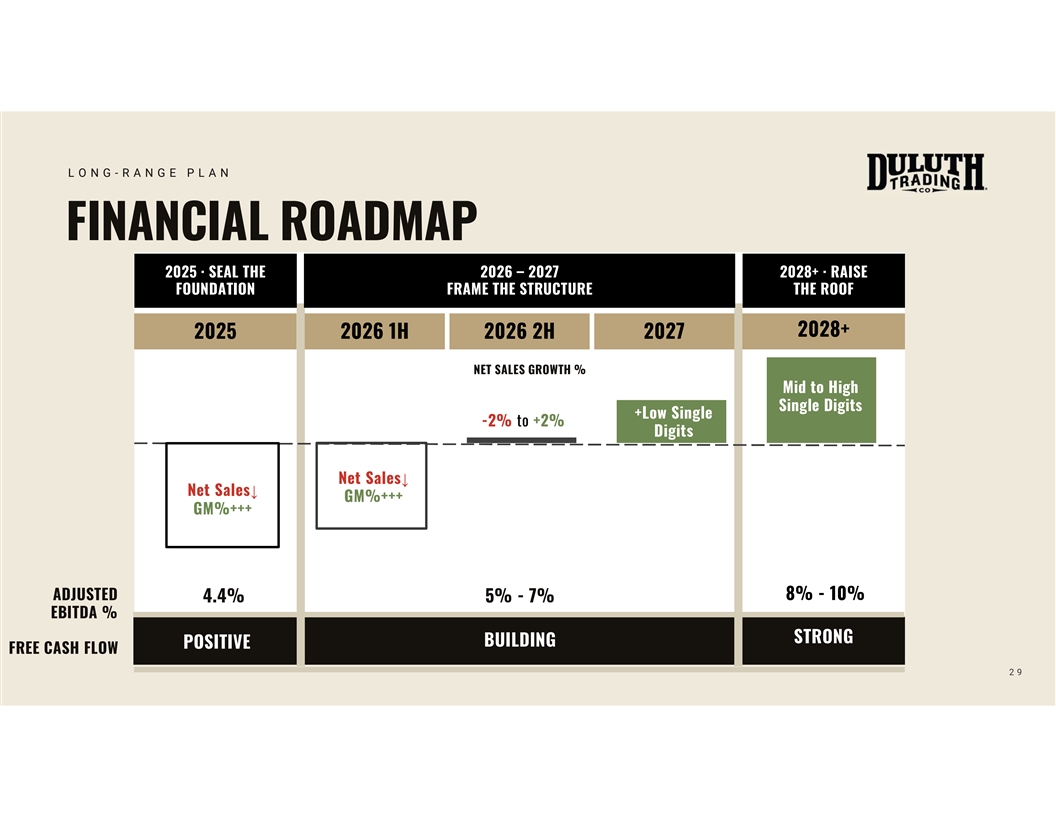
L O N G - R A N G E P L A N FINANCIAL ROADMAP 2025 · SEAL THE 2026 – 2027 2028+ · RAISE FOUNDATION FRAME THE STRUCTURE THE ROOF 2028+ 2025 2026 1H 2026 2H 2027 NET SALES GROWTH % Mid to High Single Digits +Low Single -2% to +2% Digits Net Sales↓ -6% to Net Sales↓ -10% GM%+++ -10% GM%+++ ADJUSTED 8% - 10% 4.4% 5% - 7% EBITDA % STRONG BUILDING POSITIVE FREE CASH FLOW 2 9
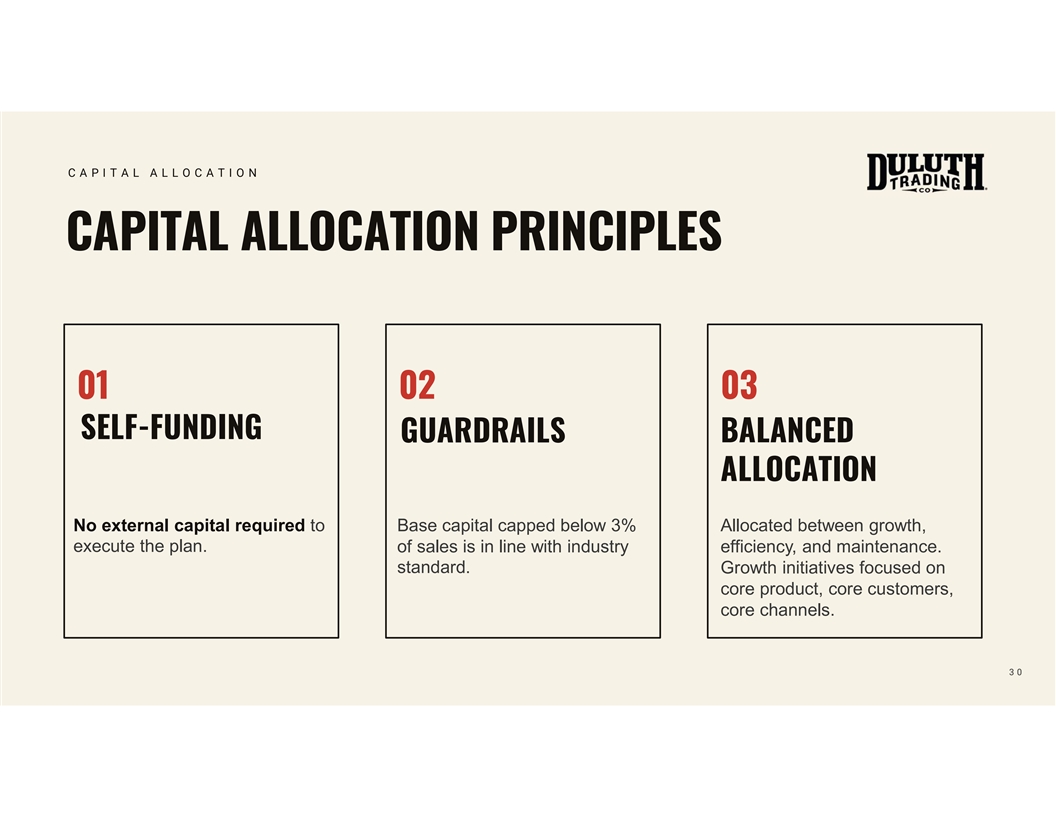
C A P I T A L A L L O C A T I O N CAPITAL ALLOCATION PRINCIPLES 01 02 03 SELF-FUNDING GUARDRAILS BALANCED ALLOCATION No external capital required to Base capital capped below 3% Allocated between growth, execute the plan. of sales is in line with industry efficiency, and maintenance. standard. Growth initiatives focused on core product, core customers, core channels. 3 0
C H A P T E R F I V E WHY INVEST 3 1
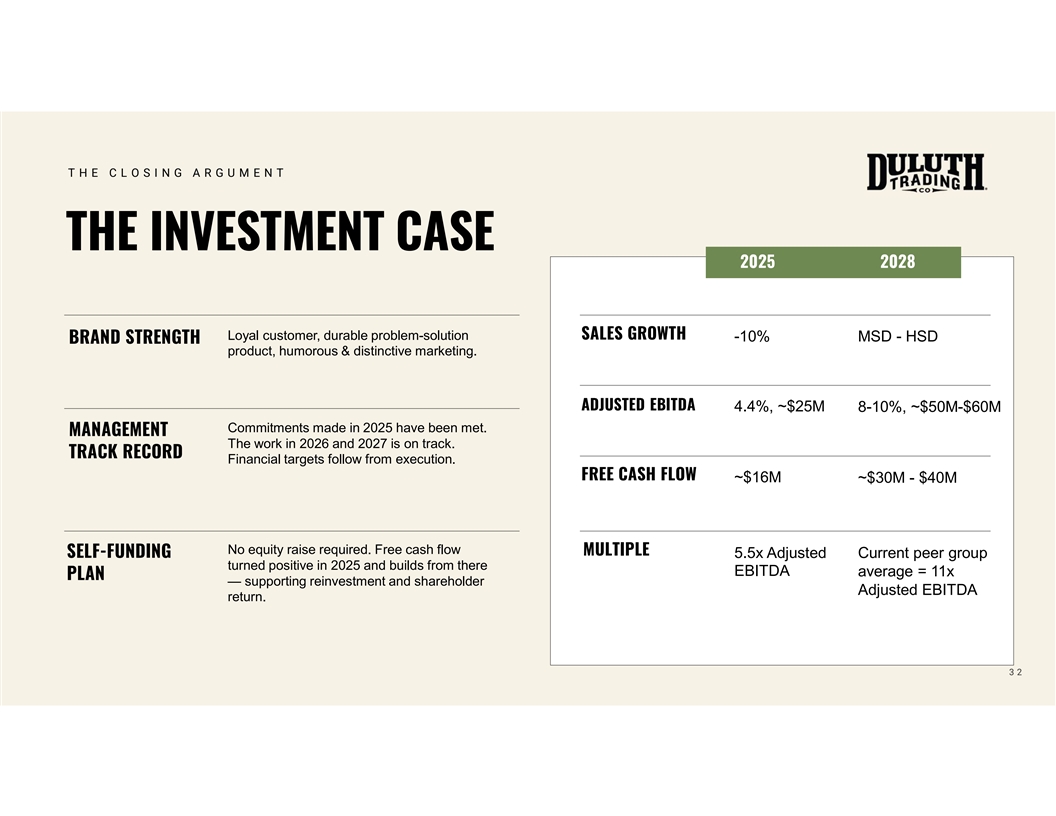
T H E C L O S I N G A R G U M E N T THE INVESTMENT CASE 2025 2028 Loyal customer, durable problem-solution SALES GROWTH -10% MSD - HSD BRAND STRENGTH product, humorous & distinctive marketing. ADJUSTED EBITDA 4.4%, ~$25M 8-10%, ~$50M-$60M Commitments made in 2025 have been met. MANAGEMENT The work in 2026 and 2027 is on track. TRACK RECORD Financial targets follow from execution. FREE CASH FLOW ~$16M ~$30M - $40M No equity raise required. Free cash flow MULTIPLE SELF-FUNDING 5.5x Adjusted Current peer group turned positive in 2025 and builds from there EBITDA average = 11x PLAN — supporting reinvestment and shareholder Adjusted EBITDA return. 3 2
— A N D N O W — CON VER SA TI ON & LUN CH TH AN K YOU
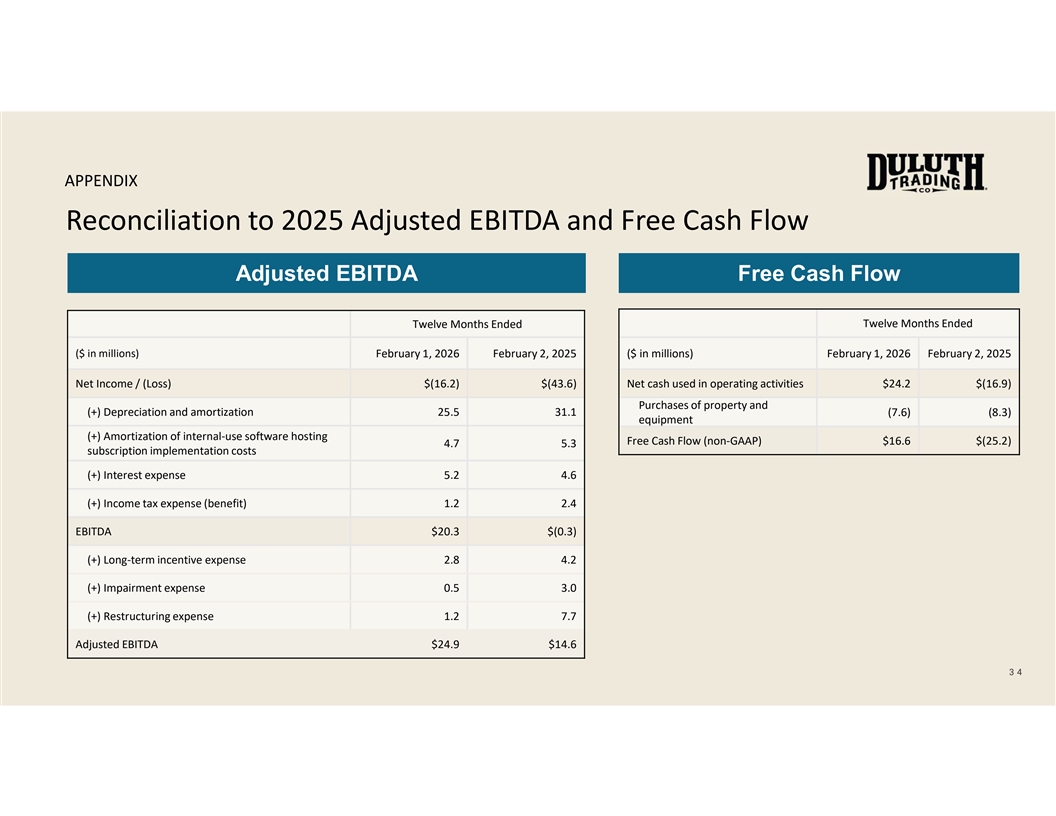
APPENDIX Reconciliation to 2025 Adjusted EBITDA and Free Cash Flow Adjusted EBITDA Free Cash Flow Twelve Months Ended Twelve Months Ended ($ in millions) February 1, 2026 February 2, 2025 ($ in millions) February 1, 2026 February 2, 2025 Net Income / (Loss) $(16.2) $(43.6) Net cash used in operating activities $24.2 $(16.9) Purchases of property and (+) Depreciation and amortization 25.5 31.1 (7.6) (8.3) equipment (+) Amortization of internal-use software hosting Free Cash Flow (non-GAAP) $16.6 $(25.2) 4.7 5.3 subscription implementation costs (+) Interest expense 5.2 4.6 (+) Income tax expense (benefit) 1.2 2.4 EBITDA $20.3 $(0.3) (+) Long-term incentive expense 2.8 4.2 (+) Impairment expense 0.5 3.0 (+) Restructuring expense 1.2 7.7 Adjusted EBITDA $24.9 $14.6 3 4
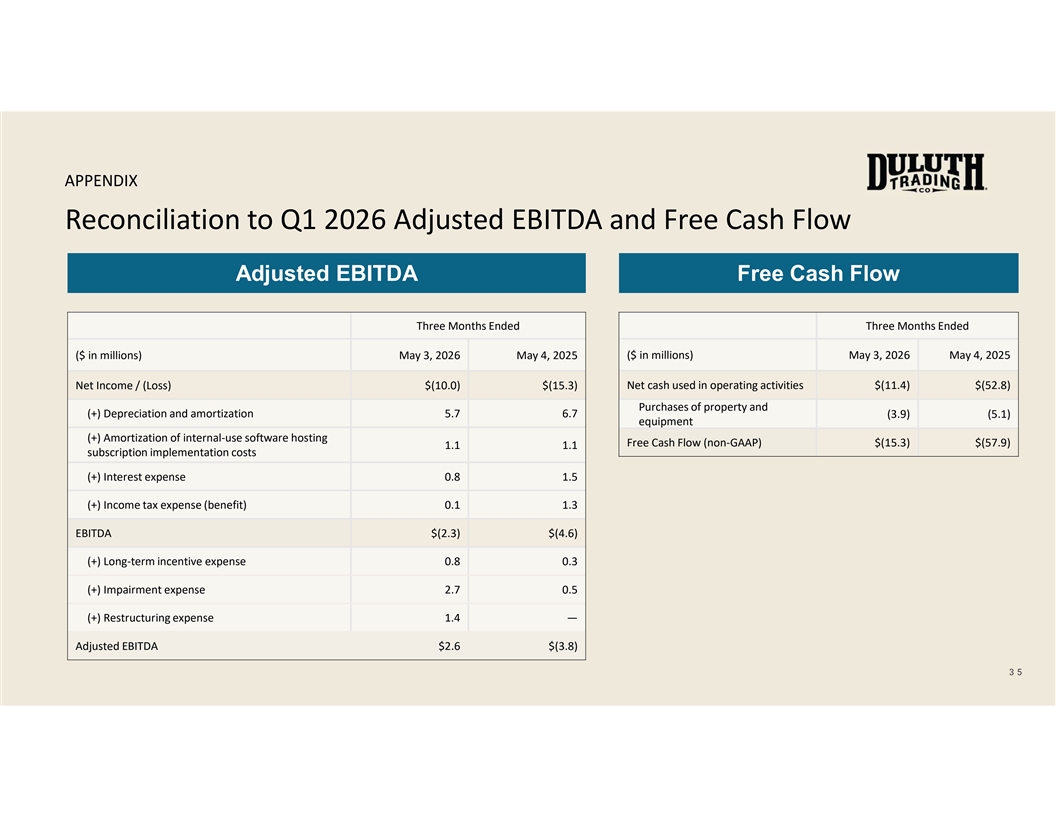
APPENDIX Reconciliation to Q1 2026 Adjusted EBITDA and Free Cash Flow Adjusted EBITDA Free Cash Flow Three Months Ended Three Months Ended ($ in millions) May 3, 2026 May 4, 2025 ($ in millions) May 3, 2026 May 4, 2025 Net Income / (Loss) $(10.0) $(15.3) Net cash used in operating activities $(11.4) $(52.8) Purchases of property and (+) Depreciation and amortization 5.7 6.7 (3.9) (5.1) equipment (+) Amortization of internal-use software hosting Free Cash Flow (non-GAAP) $(15.3) $(57.9) 1.1 1.1 subscription implementation costs (+) Interest expense 0.8 1.5 (+) Income tax expense (benefit) 0.1 1.3 EBITDA $(2.3) $(4.6) (+) Long-term incentive expense 0.8 0.3 (+) Impairment expense 2.7 0.5 (+) Restructuring expense 1.4 — Adjusted EBITDA $2.6 $(3.8) 3 5